in the top toolbar > select the 'Reports' option. In the reports page click the blue 'Synergy OData export' button.
in the top toolbar > select the 'Reports' option. In the reports page click the blue 'Synergy OData export' button.
Tips:
OData is an industry standard method used to export information from databases, to allow the information to be used in external reporting tools. Learn about the technical side of Odata at the OData website.
The Synergy OData interface lets you export many tables of Synergy data, and quickly refresh the data in third party reporting tools using a direct connection your companies database stored in Synergy Cloud Services. This direct connection to your database lets you get the latest reporting information for your Synergy data to be easily imported into third party reporting tools.
Tableau is business intelligence software used to create visualisations, dashboards, stories, and reports. What is Tableau?
Tableau reports are created in a desktop application using the Synergy OData connection, and published to Tableau online. Contact the Tableau team for pricing information or help with the software.
Use Tableau to create visualisations, dashboards, stories, and reports using your Synergy data exported using the OData connection.
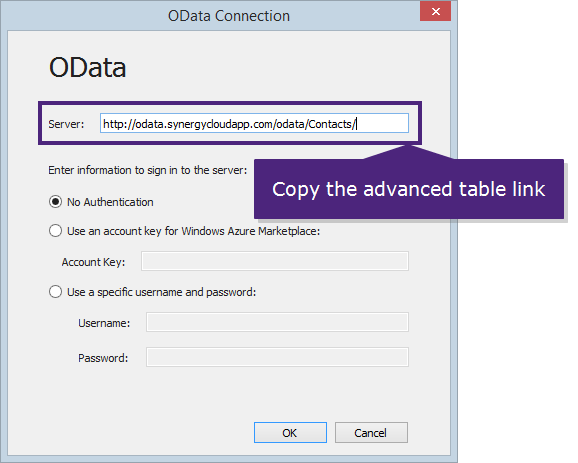
Use the advanced table links below when setting up an OData connection in Tableau. Tableau requires the data connection be setup to each Synergy table separately.
Repeat setup OData connection steps for each table your require in your report, and copy the link below when configuring the OData connection to a Synergy table.
Contact Attributes - http://odata.synergycloudapp.com/odata/ContactAttributes/
Tips:
Use the 'filter the data' options in Step 2 within Synergy Cloud Services, to restrict what data exported in your companies OData feed. Filter options available are:
Select one or more status options to be included in the data export. The status options selected restrict which projects, sub projects and linked transactions are exported. The OData tables effected by this filter are: Projects, Sub Projects, Transactions, Forecast, Project Attributes, Sub Project Attributes, Project Managers, Sub Project Managers, Project Primary Contacts, Project Invoice Contacts.
Example
The report should only have the items that are not linked to a projects that is complete or unsuccessful (lost).
Type a date, or select a date from the drop down calendar. The date filter controls the start date for the data export from using your companies OData feed.
OData tables effected by this filter are: Invoice contacts, Supplier bills / Expenses, Invoices, Invoice Lines, Transactions, Sub Project Status, Project Status, Forecast, Date format variations.
Tip: The export or refresh time for your report will be faster if you use the date restriction filter.
Control which invoice types are exported using OData. Include or exclude any credit notes, write-off credit notes, cancelled invoice credit notes, and draft invoice.
OData tables effected by this filter are: Invoices, Invoice Lines, and Invoice Contacts.
Tip: Draft invoices are only shown in the invoice header table export, not in the invoice lines table.
Import your Synergy data into Tableau using the advanced table links. Tableau help files - instructions on using OData.
Overview of setting up an OData connection in Tableau for your Synergy data:
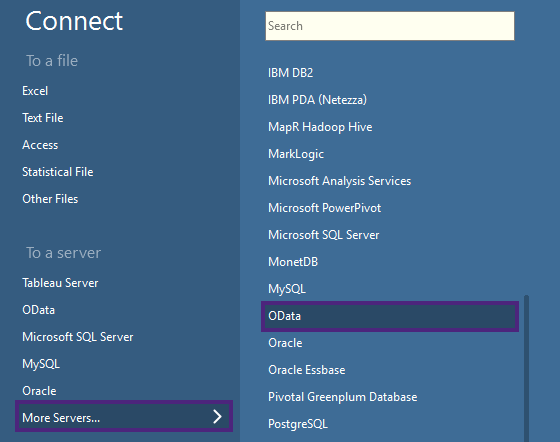
Click the image above to see the OData option in the Tableau menu.
Click the image above to see the Synergy table link.
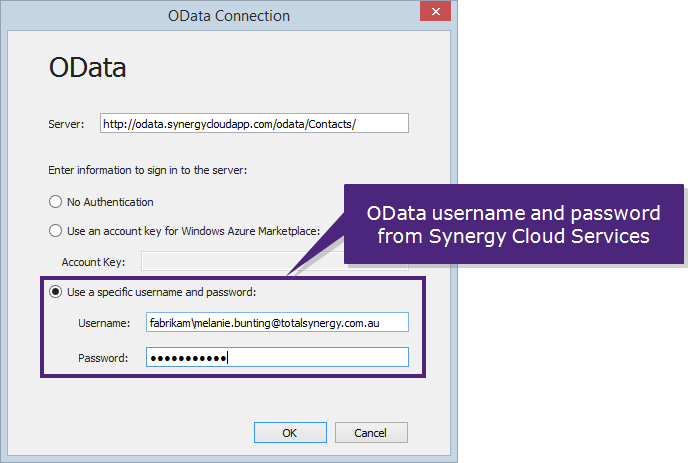
Click the image above to see the OData username and password in Tableau.
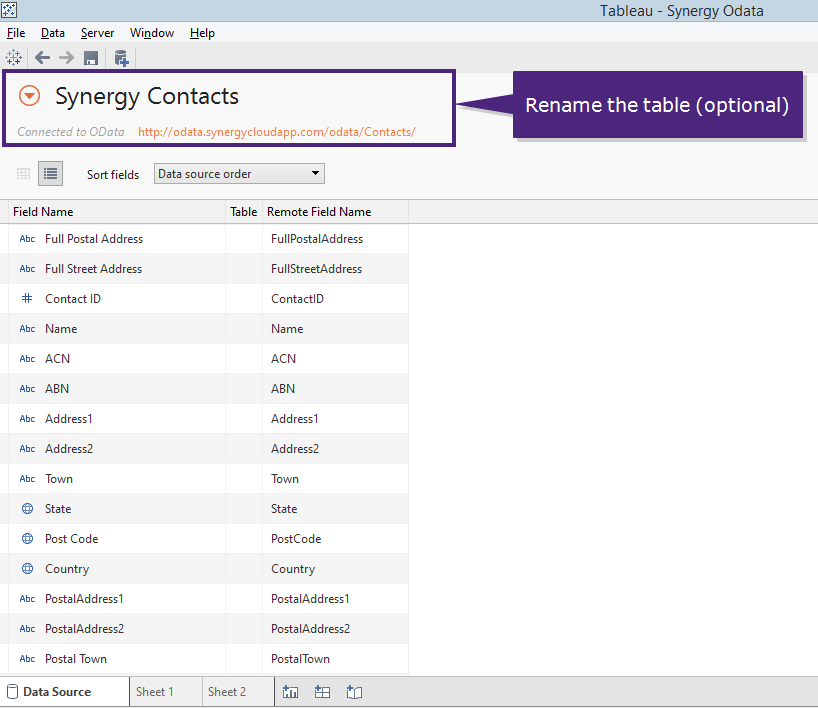
Click the image above to rename a table in Tableau.
For detailed information on how to use Tableau to create reports and dashboard, please contact Tableau or watch the Tableau training videos.
Below are a few tips from the Synergy team on what to setup in Tableau to create reports.
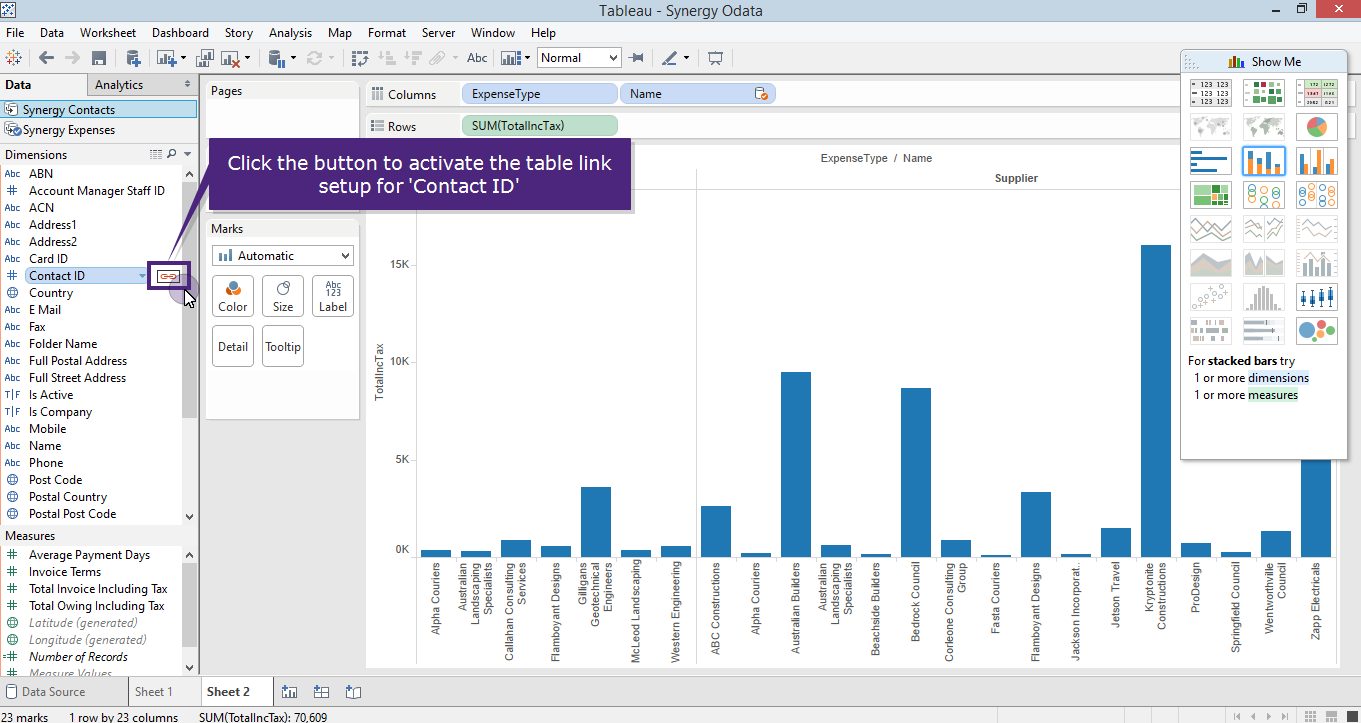
Links between the Synergy tables need to be setup. The table links should be setup using the 'data source fields' with the word ID included in the name. e.g. Add a relationship link between the 'Contact ID' field in the Contacts table (as the primary data source) to the 'Contact ID' field in the Expenses table (as the secondary data source). Follow the below steps to create the link for this example.
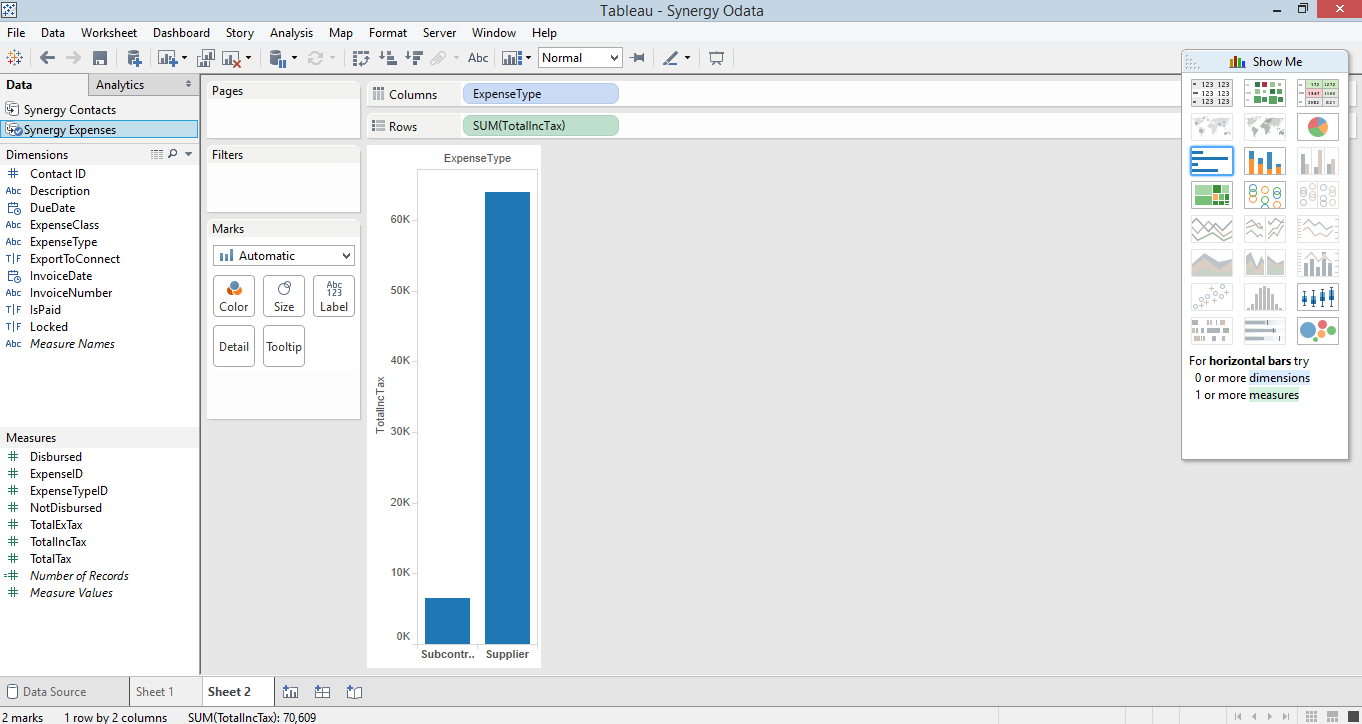
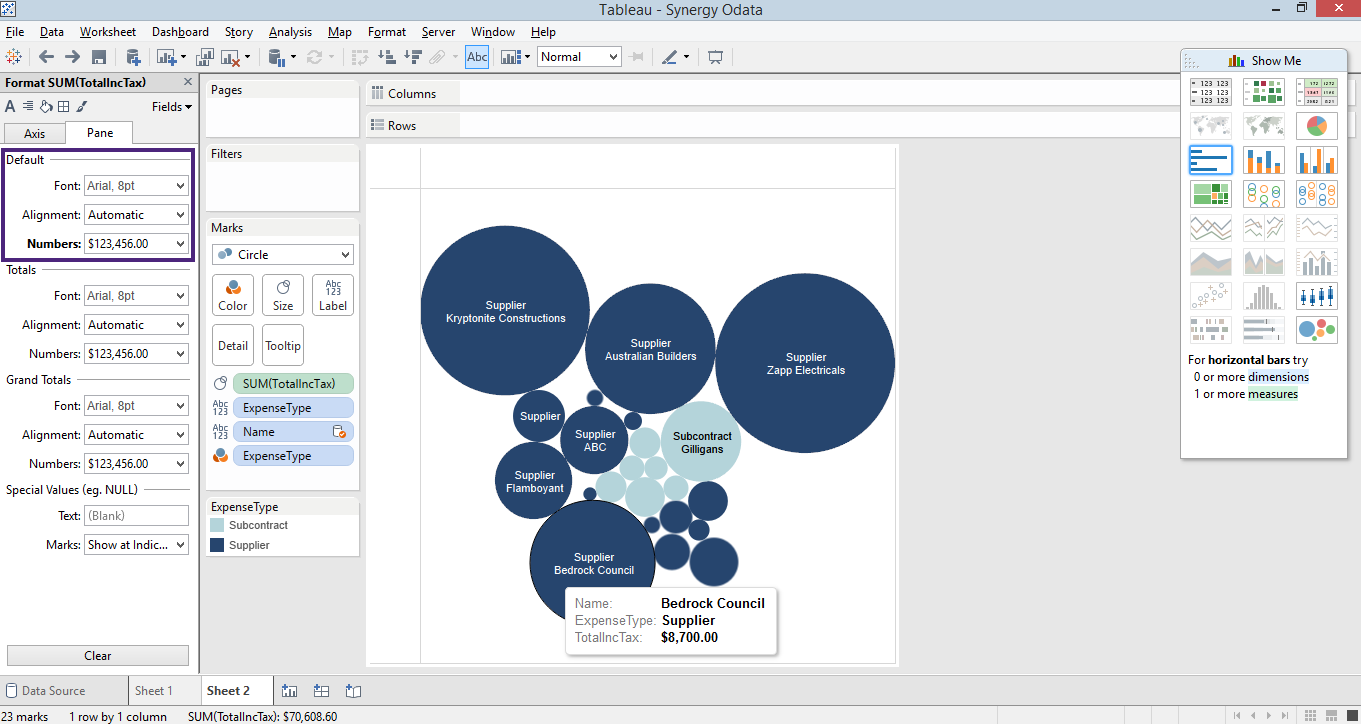
After creating the relationship links you can now create reports using the data from the links tables. In the example below we have linked together the 'Contacts' and 'Expenses' table using the 'ContactID' field.
Click the image above to see the two columns selected from the Expenses table.
Click the image above to see the link button.
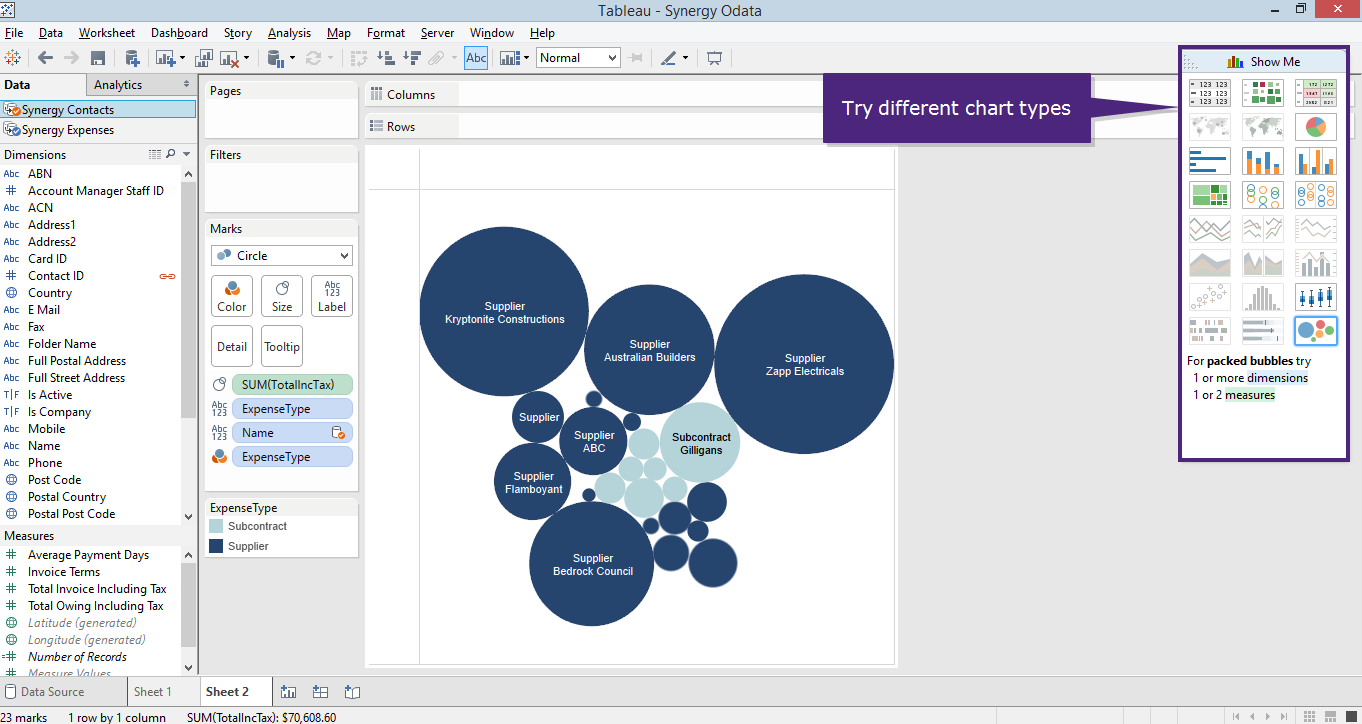
Click the image above to see the different chart type options.
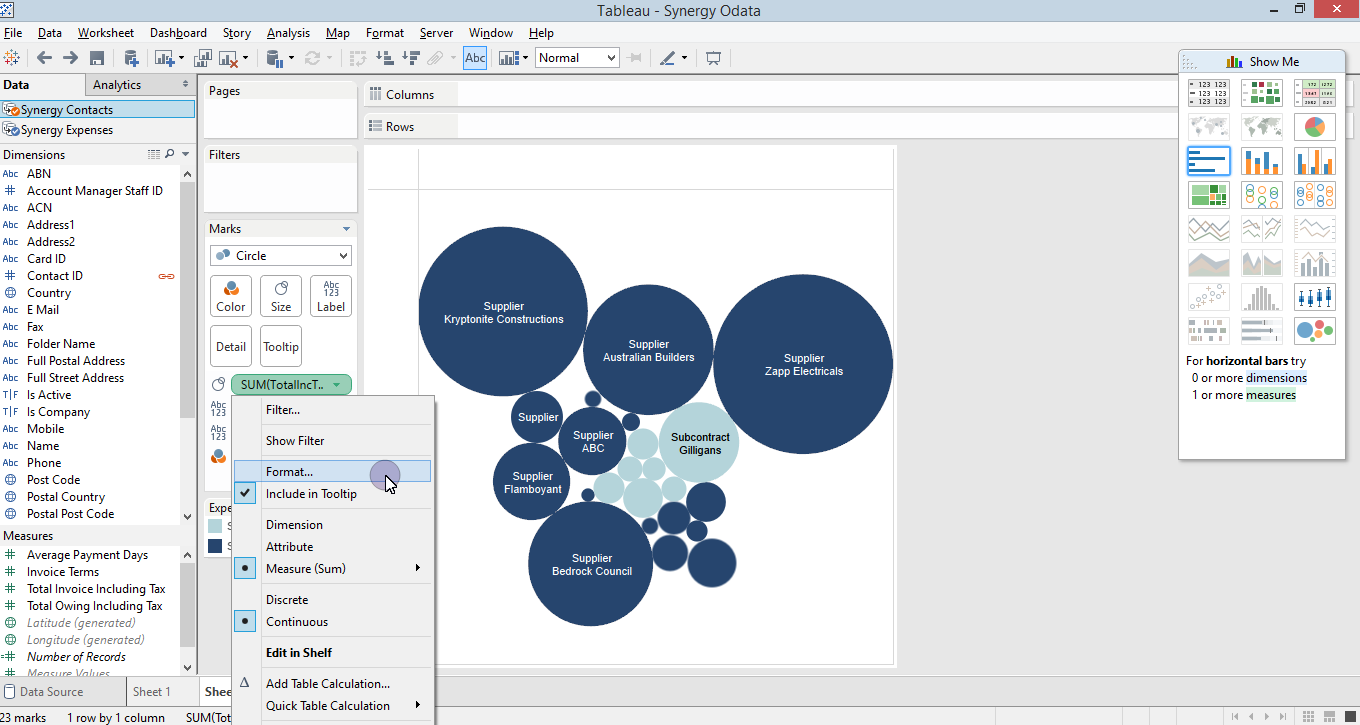
Click the image above to see how to change the number field format to currency.
Tip: For more reporting ideas watch the Tableau training videos.
Tip: Tableau instructions in this document were written for using Tableau 9.2 desktop product.
Looking for more help? Try reviewing the following topics: ![]() View Topics
View Topics
© 2018 Total Synergy Pty Ltd